
COD, PRD, and Uniformity: What Every NJ Assessor Needs to Know
Bridges AI
AI Strategy & Engineering
IAAO uniformity standards are increasingly the benchmark county tax boards and the NJ Division of Taxation use to judge your work. Two metrics matter most: the Coefficient of Dispersion (COD) and the Price-Related Differential (PRD).
What does COD tell you?
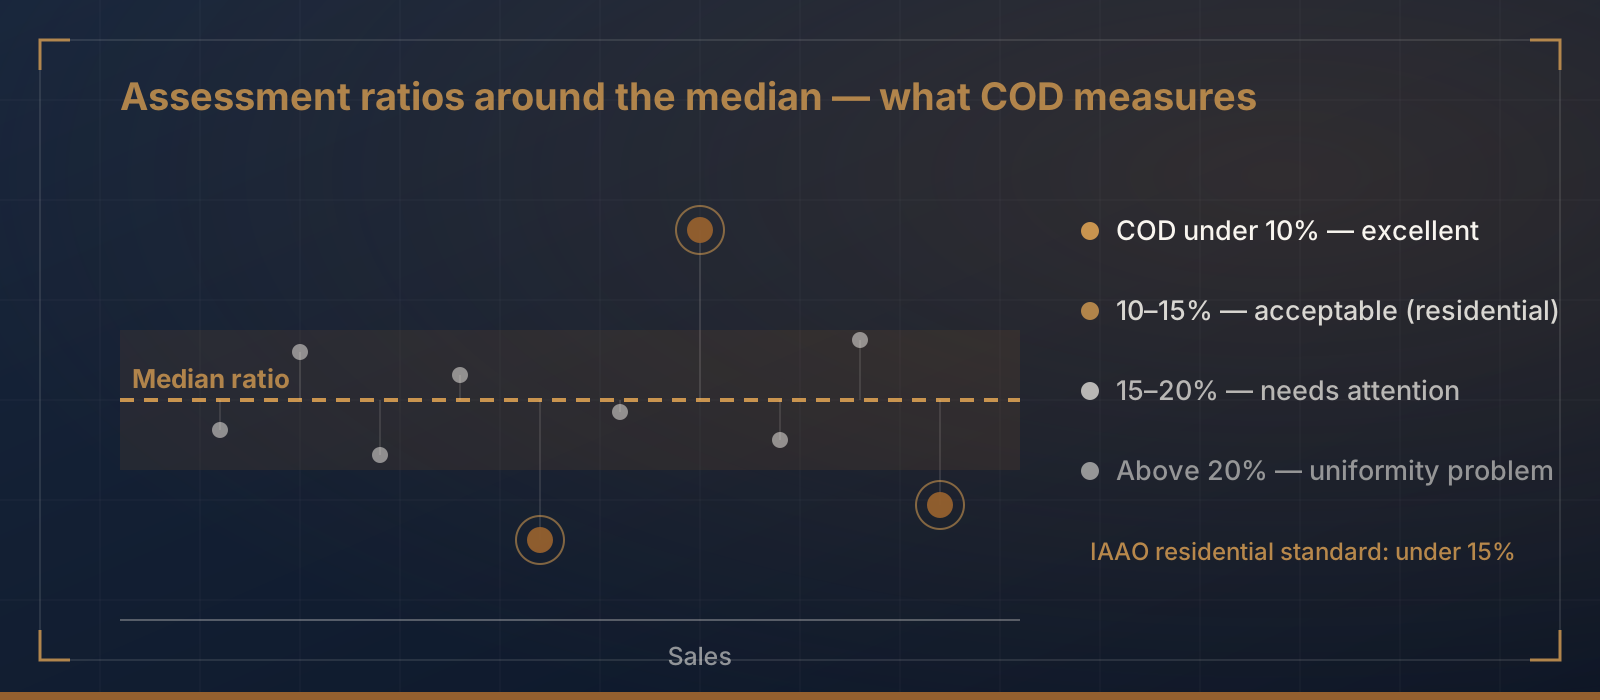
COD measures how much individual assessment ratios vary around the median, so it answers how consistent your assessments are.
- Below 10%: excellent uniformity.
- 10-15%: acceptable for residential properties per IAAO standards.
- 15-20%: needs attention. Variability is creating inequity.
- Above 20%: significant uniformity problems. Appeals are likely and the county tax board may flag your municipality.
IAAO allows higher thresholds for commercial and industrial properties, up to 20%, but residential should stay under 15%.
What does PRD reveal?
PRD detects regressive or progressive patterns: whether high-value properties are assessed differently than low-value ones.
- 1.00: perfect equity across price ranges.
- Above 1.03: regressive. Lower-value properties bear a disproportionate tax burden.
- Below 0.98: progressive. Higher-value properties are over-assessed relative to sales prices.
New Jersey has historically shown regressive patterns where municipalities haven't revalued recently. Rising values push Director's Ratios down unevenly, and the fastest-appreciating neighborhoods drift furthest from their assessed values.
Across the state's 564 municipalities, recent revaluations typically show CODs under 12%; towns that haven't revalued in a decade or more often exceed 20%. The Director's Ratio is the most visible metric, but COD and PRD say whether assessments are equitable across property types and price ranges.
How does AI improve uniformity?
Traditional reviews are sample-based: pull a set of sales, compute ratios, spot-check outliers.
- Full-population analysis. Rather than sampling 5-10% of sales, models compute individual assessment ratios for every parcel across the entire tax roll.
- Stratified metrics. A single residential COD masks variation. Computing uniformity by neighborhood, property class, age cohort, and price band shows where inequity concentrates.
- Predictive outlier detection. Flag parcels whose ratio deviates sharply from the median before anyone files an appeal.
What should you do?
- Request your current COD and PRD from the county tax board if you don't compute them locally.
- Break them down by property class. An overall COD of 14% might mask a residential COD of 11% and a commercial COD of 25%.
- Find geographic clusters of high-variance parcels, often in neighborhoods with rapid market changes.
- Consider targeted reassessment of the largest deviations. A full revaluation is not required to improve uniformity.
Bridges AI computes IAAO-compliant uniformity metrics for NJ municipalities. See how your COD and PRD break down by property class and neighborhood. Request an audit.
Related posts
How Satellite Imagery Is Transforming NJ Property Assessment
Computer vision and aerial imagery are giving NJ assessors new tools to detect property changes, verify conditions, and maintain assessment accuracy without knocking on every door.
Property Assessment2026 NJ Appeal Season: The Assessor's Preparation Checklist
Appeal filing deadlines are approaching. Here's a practical checklist for NJ tax assessors to prepare defensible valuations and minimize revenue loss.
Property AssessmentWhy Your Director's Ratio Should Worry You (And What AI Can Do About It)
New Jersey municipalities with Director's Ratios below 85% face mounting appeal risk. Here's how AI-powered assessment intelligence helps assessors stay ahead.